Data Visualization Application (DVA)

Class Project: Apr 2016 – Jun 2016 (3 months)
Role: Designer, Product Manager (Team: 4 members)

Class Project: Apr 2016 – Jun 2016 (3 months)
Role: Designer, Product Manager (Team: 4 members)
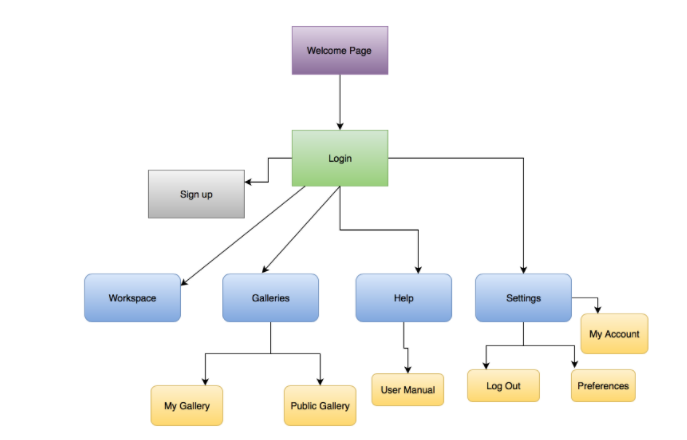
As part of a class project, we had the opportunity to work for a real world client. We built a data visualization application that allowed users to tell their data stories using a notebook style format.
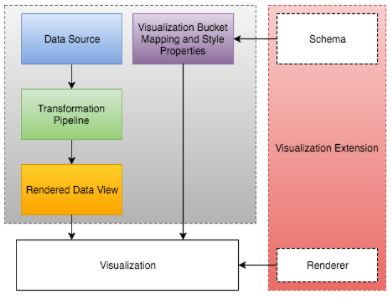
The goal of this project was to create a software appliance that allows for manipulation and visualization of data through the D3.js JavaScript Library.
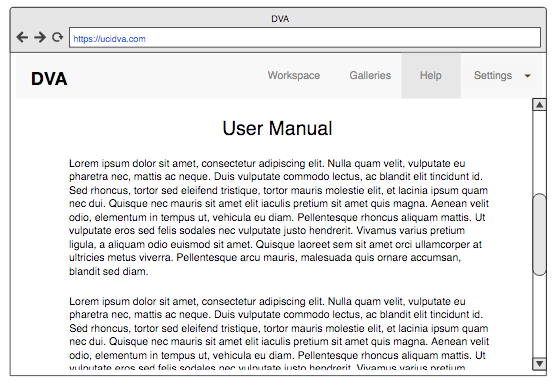
This is the “Help” page or User manual page and this is a page requested specifically from the project sponsor in wanting a sort of user guide that gives instructions or help on how to fully utilize the site.
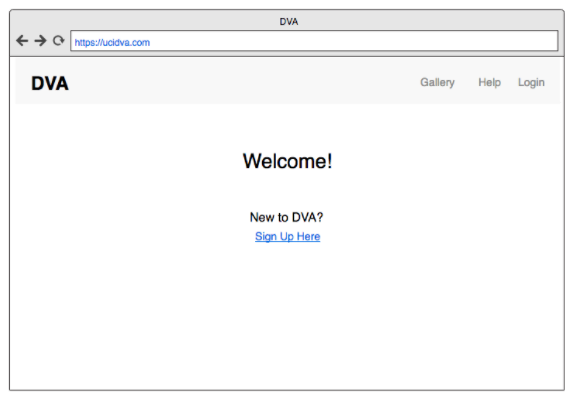
This mockup represents the welcome page of our site, this is the first page a user will see when they first enter the site.

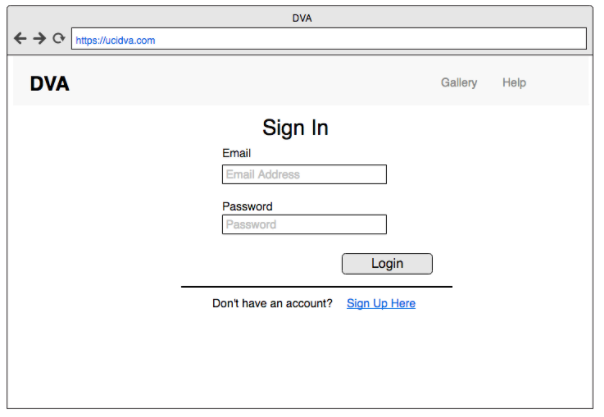
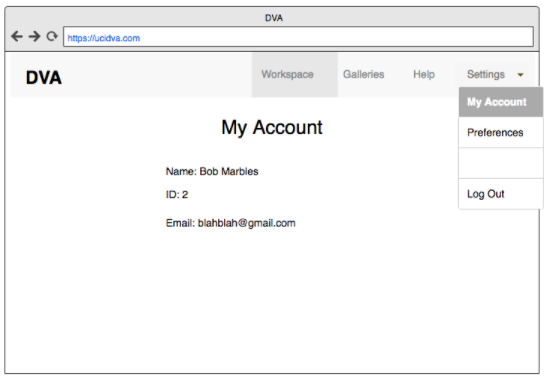
This is a mockup of the “My Account” page. Once a user has logged into their account, they can access and change their settings as needed.
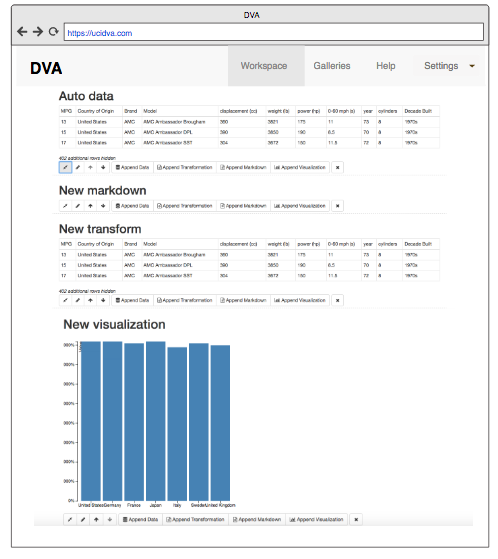
This is our main workspace page of our site. This is where users can create and edit the visualization of their choice based on the data set they choose to work with. The new workspace page is a notebook style, where users can add (append buttons), edit(little pencil button), move up and down(up and down arrows), minimize(arrows facing each other) and remove( the ‘x’ button) cells.

This is where users will be able to view all of the the visualizations they have already made. They will have the option of being able to look at a public gallery where all users can share with other users the visualizations they have made through our site.